Ask Professor Puzzler
Do you have a question you would like to ask Professor Puzzler? Click here to ask your question!
I was up at 3:30 AM today, so I decided to create a Christmas graph for all of my friends. This graph is made up of several inequalities combined with ∩ (intersection) and ∪ (union), and I hope you'll stick with me to the end to see what it looks like. Are you ready?
Let B be the equation: y2 + 0.5y ≤ 0; {-0.5 ≤ x ≤ 0.5}
Let S be the equation: 81x4 - 18x2y2 + 153x2y -326.25x2 + y4 - 17y3 + 108.25y2 - 306y + 324 ≥ 0 {-1/12 ≤ x ≤ 1/12}
Let C1 be the equation: (x - 0.3)2 + (y - 2.5)^2 - 0.0625 ≤ 0
Let T be the equation: 4x2y - y3 + 8y2 - 16y ≤ 0
Let C2 be the equation: x2 + y2 - 3y - 4 ≤ 0
Let O be the equation: [(x - .3)2 + (y - 2.5)2 - 0.02][(x - .3)2 + (y - 2.5)2 - 0.02][(x - .3)2 + (y - 2.5)2 - 0.02] ≥ 0
Let G be the equation: (y - .1 - .2(x - 1)2)(y - .2 - .2(x - 1)2)(y - 1.3 - .2(x - 1)2)(y - 1.4 - .2(x - 1)2)(y - 2.2 - .2(x - 1)2)(y - 2.3 - .2(x - 1)2)(y - 3.2 - .2(x - 1)2)(y - 3.3 - .2(x - 1)2) ≥ 0
Now graph the following:
B ∪ (S ∩ C1) ∪ (T ∩ C2 ∩ O ∩ G)
Okay, okay, this thing is ugly. I'm going to make it a little less ugly by factoring S, B, and T for you. You should be able to factor B and T on your own, but I'm certainly not going to ask anyone to factor S, so I'll just tell you how it factors. If you want to factor B and T on your own, take a moment to do so before reading further.
S factors into: (3x + y - 4.5)(3x - y + 4.5)(3x - y + 4)(3x + y -4) ≥ 0 {-1/12 ≤ x ≤ 1/12}
B factors into y(y + 0.5) ≤ 0; {-0.5 ≤ x ≤ 0.5}
T factors into: y(2x + y - 4)(2x - y + 4) ≤ 0 (see the factoring process)
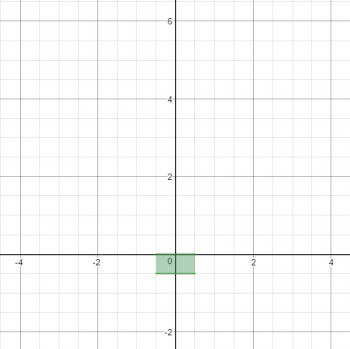
Let's begin by graphing the easiest part of this: B.
Since y(y + 0.5) ≤ 0, we can conclude that y must be between 0 and -0.5, so that the product of the two factors will be less than 0. However, we are also given the stipulation that x is between -0.5 and +0.5, which results in a simple box.
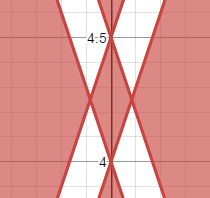
Now let's take a look at the intersection of S and C1. S is a multiplication of four factors which are all linear, and they are in parallel pairs, which means this is going to be a parallelogram. Inside the parallelogram, two of the factors are negative and two are positive, which makes the whole thing positive. The graph looks like the picture to the right.
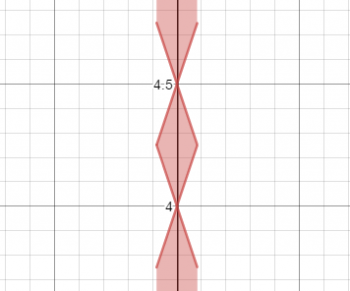
However, we have placed restrictions on the domain of this equation; x has to be between -0.5 and +05, which limits the graph as shown at the right.
We still are not finished with this section of the graph; we have to intersect this with the equation C1. This graph is a circle with center at (0, 4.25), and the interior of the circle is included. This further limits the graph to nothing but the rhombus.
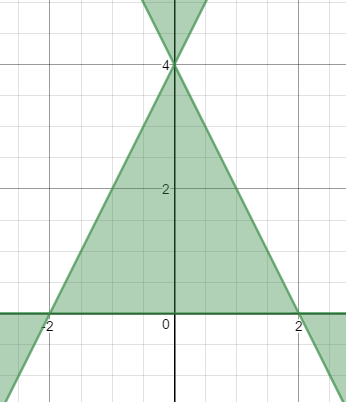
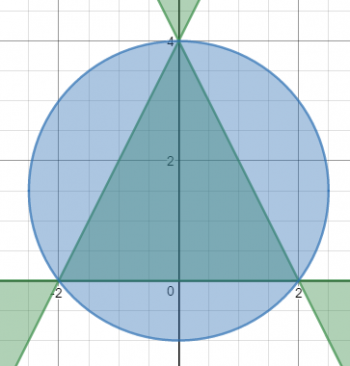
Okay, now the really challenging part. Equation T is very similar to equation S, except that instead of four factors, there are three. Thus, this contains a triangle, and since there are an odd number of factors, and they multiply to something less than or equal to zero, the interior of the triangle is included.
What's next? Well, in case you hadn't guessed C2 is also a circle, and we're intersecting the interior of the circle with the triangle graph, which gives us the next graph.
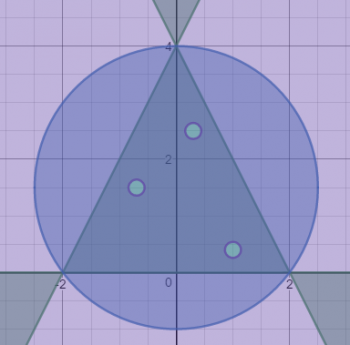
Then we have to deal with that hideous equation O, which appears to be...three circle factors multiplied together. If a point is on the interior of any of those three circles, that factor will be negative, and the other two will be positive, giving a negative result. However, equation O has the product greater than or equal to zero, which means that points satisfying O lie on or outside the three circles. The circles are all pretty small, and they're scattered around inside the triangle. Thus, we have the interior of a triangle, minus three circles, giving us the graph shown here.
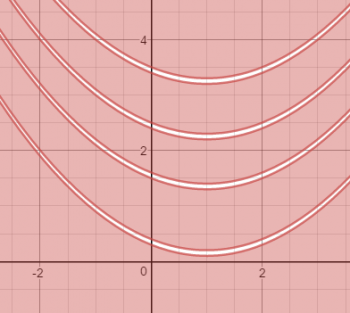
What next? The even uglier equation G, which is a series of parabolas multiplied together as shown here.
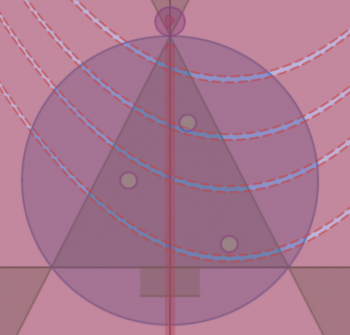
Now, if you were to take all of these and overlay them on top of one another, they would look something like this:
But...we're not overlaying them all; we have to take the intersection of T, C2, O and G, and we also have to take the intersection of S and C1. Then we overlay them (because it is a union of three separate graphs). I've shown them here with distinct colors for each of the three parts combined. Brown for the base (B), green for the tree (Tree ∩ Circle2 ∩ Ornaments ∩ Garland), and yellow for the star (Star ∩ Circle1).

Have a wonderful, Merry Christmas!
Professor Puzzler
P.S. Graph screen captures came from this graphing calculator.